
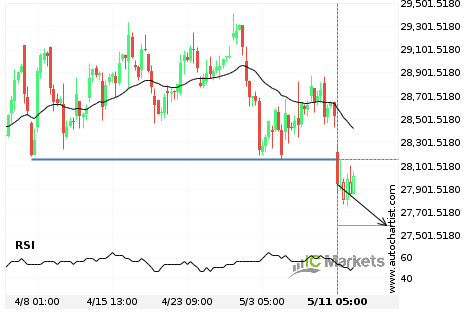
Hong Kong 50 Index broke through important 28157.5996 price line
Hong Kong 50 Index has broken through the support line of a Support. It has touched this line numerous times in the last 34 days. This breakout shows a potential move to 27592.2402 within the next 3 days. Because we have seen it retrace from this position in the past, one should wait for confirmation […]

A final push expected on FTSE China A50 Index
FTSE China A50 Index is heading towards a price line of 17197.0508 and could reach this point within the next 2 days. It has tested this line numerous times in the past, and this time could be no different from the past, ending in a rebound instead of a breakout. If the breakout doesn’t happen, […]
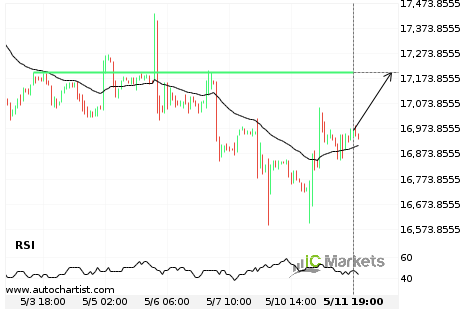
Where is Hong Kong 50 Index moving to?
A movement of 2.39% over 15 hours on Hong Kong 50 Index doesn’t go unnoticed. You may start considering where it’s heading next, a continuation of the current downward trend, or a reversal in the previous direction.
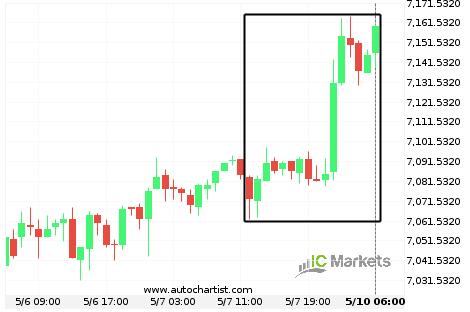
Australia 200 Index experienced an exceptionally large movement
For those of you that don’t believe in trends, this may be an opportunity to take advantage of an exceptional 1.24% move on Australia 200 Index. The movement has happened over the last 3 days. For those trend followers among you, you may think about riding this trend.
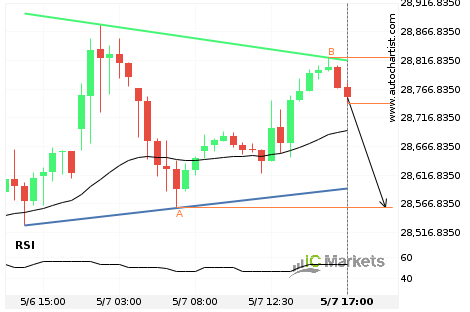
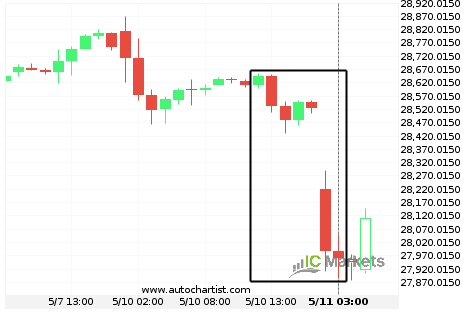
Hong Kong 50 Index – getting close to support of a Triangle
Hong Kong 50 Index is moving towards the support line of a Triangle. Because we have seen it retrace from this line before, we could see either a break through this line, or a rebound back to current levels. It has touched this line numerous times in the last 2 days and may test it […]
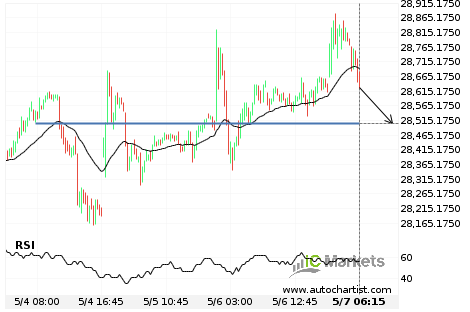
Hong Kong 50 Index approaching important 28504.5000 price line
Hong Kong 50 Index is approaching the support line of a Support. It has touched this line numerous times in the last 3 days. If it tests this line again, it should do so in the next 10 hours.
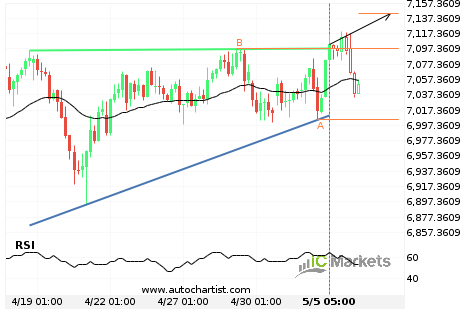
Australia 200 Index has broken through resistance
Australia 200 Index has broken through the resistance line of a Ascending Triangle. It has touched this line at least twice in the last 19 days. This breakout indicates a potential move to 7143.5154 within the next 3 days. Because we have seen it retrace from this positions in the past, one should wait for […]

FTSE China A50 Index – psychological price line breached
FTSE China A50 Index has broken through the resistance line of a Resistance. Because we have seen it retrace from this position in the past, one should wait for confirmation of the breakout before trading. It has touched this line numerous times in the last 8 days and suggests a target line to be around […]